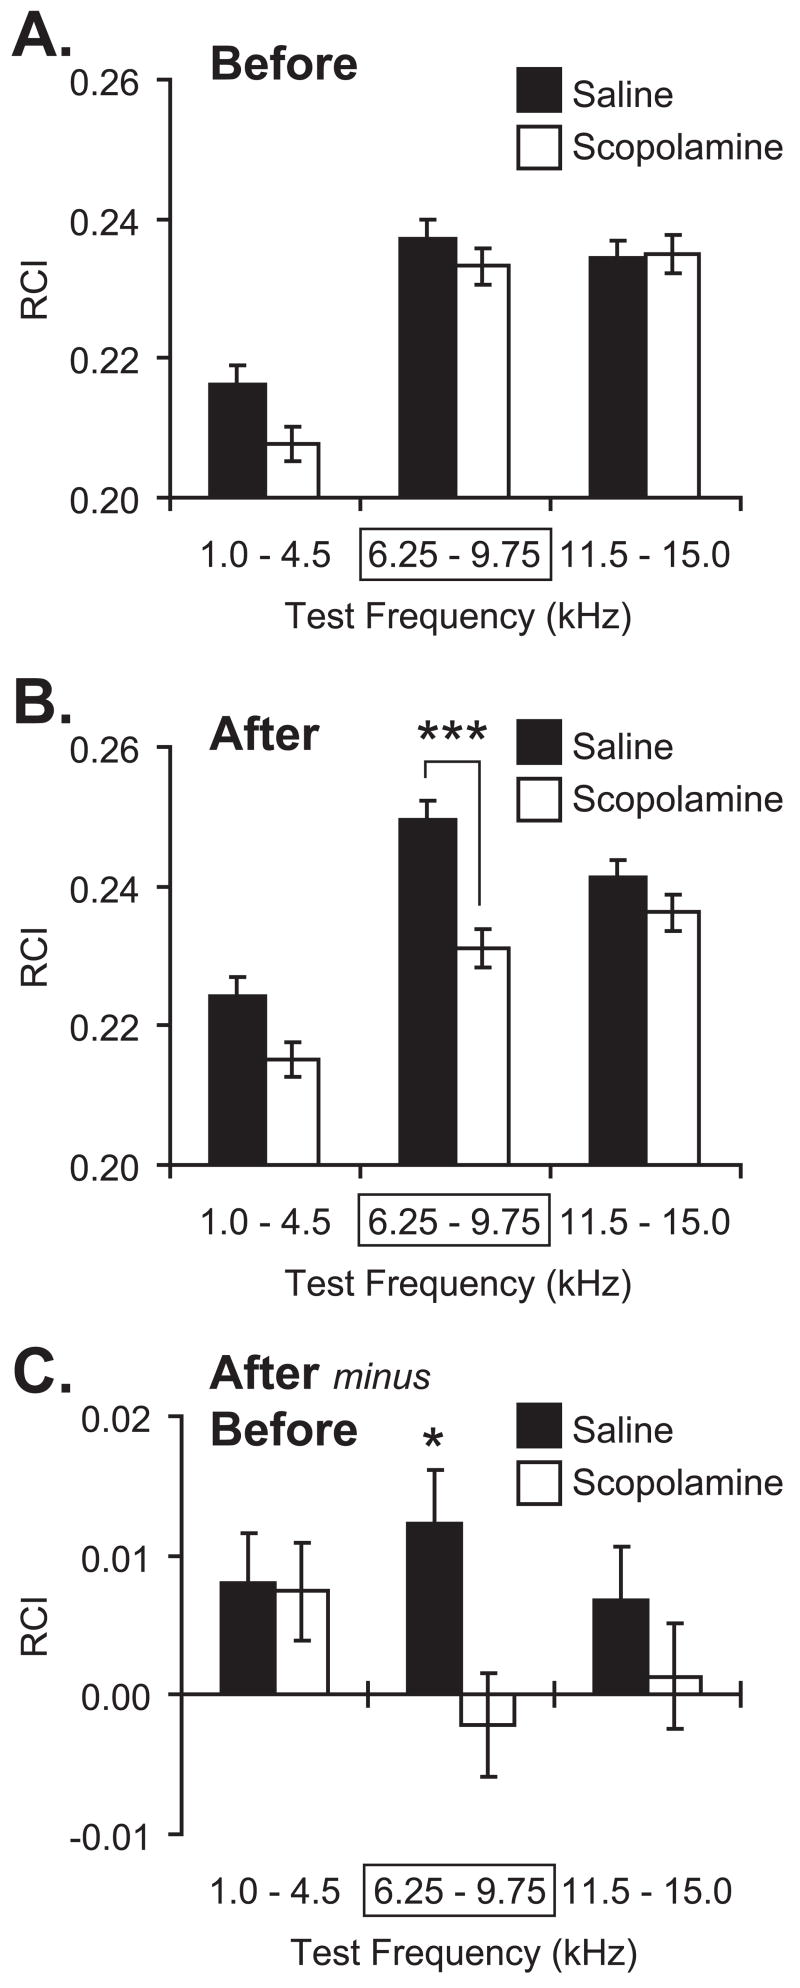
Figure 5.
Effect of post-training scopolamine on NB-induced memory. Graph bars show Mean ± SE of Respiration Change Index, RCI (Y-axis). (A) Pre-training (“Before”) frequency generalization gradients to tones in three frequency bands: “Low” (1.0–4.5 kHz), “CS” (6.25–9.75 kHz [framed with rectangle]; the CS was 8.00 kHz); “High” (11.5–15.0 kHz). There were no significant differences between Saline (black bars) and Scopolamine (white bars) groups before training. (B) Post-training/post-injection (“After”) generalization gradients for the Saline and Scopolamine groups. Note the significant difference in response in the CS band between the Saline and Scopolamine groups. There was no significant differences at the Low and High frequency bands. (C) Comparison of within-group changes (“After minus Before”: post-training minus pre-training responses to test tones) in behavioral generalization gradients. Note that the Saline group had developed a statistically significant increase exclusively within the CS-frequency band. In contrast, the Scopolamine group had not developed any statistically significant changes following pairing/injection. *p < 0.05; ***p < 0.005, two-tailed t-tests.

