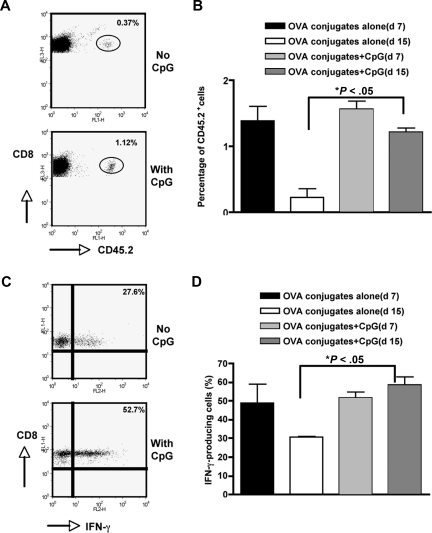
Figure 3.
Prolonged T-cell survival by CpG. Similar to Figure 2C, 2 million CD8 OT-I T cells were administrated to SJL mice. Mice were immunized with 2.5 μg anti–CD19-OVA conjugates in the presence or absence of CpG (50 μg/mouse). Splenocytes were harvested at day 7 or day 15 and the percentage of CD45.2+ cells was determined by flow cytometry. Cells were gated on the CD8+ population. (A) Representative dot plots showing CD8+CD45.2+ cells at day 15. (B) Percentage of CD8+CD45.2+ cells (n = 5). (C) Splenocytes harvested on day 15 were restimulated with OVA (10 μg/mL) and intracellular IFN-γ staining was performed. Representative dot plots showing IFN-γ staining. Cells were gated on the CD8+CD45.2+ population. (D) Percentage of IFN-γ–producing CD8+ T cells. Cells were gated on the CD8+CD45.2+ population (n = 5). Error bars represent SEM.

