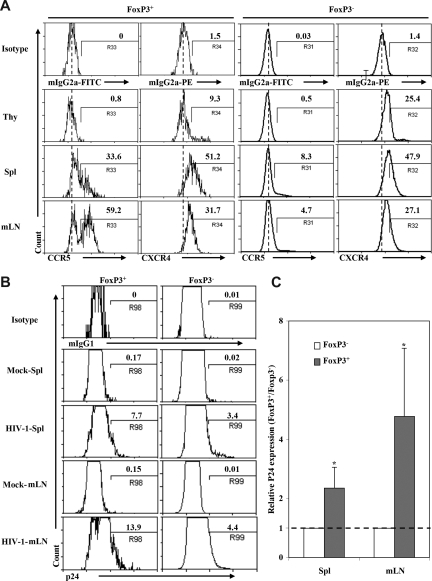
Figure 3.
HIV preferentially infected Treg cells in DKO-hu HSC mice in vivo. (A) Expression of HIV-1 coreceptors on human CD4+ T cells from different lymphoid organs in DKO-hu HSC mice. Cells shown were gated on human CD45+CD3+CD4+CD8− cells. CD4+FoxP3+ or CD4+FoxP3− cells were further analyzed for expression of CCR5 and CXCR4. Numbers indicate percentage of positive cells, and the dashed line indicates isotype control signals (the median fluorescence intensity of control staining). (B) Infection of FoxP3+ and FoxP3− CD4 T cells in DKO-hu HSC mice by HIV-R3A (X4/R5 dual tropic). Mock supernatant was used as negative control. DKO-hu HSC mice were killed at 1 week after infection, and levels of intracellular p24 on FoxP3+CD4+ or FoxP3−CD4+ (CD45+CD3+CD8−) T cells from spleen and mLN were analyzed. Numbers indicate percentage of p24+ cells. (C) Summary of relative p24 expression in FoxP3+ or FoxP3− CD4 T cells from spleen and mLN. Data shown are representative of 2 independent experiments with at least 3 mice in each group. *P < .05. Error bars display standard deviations.

