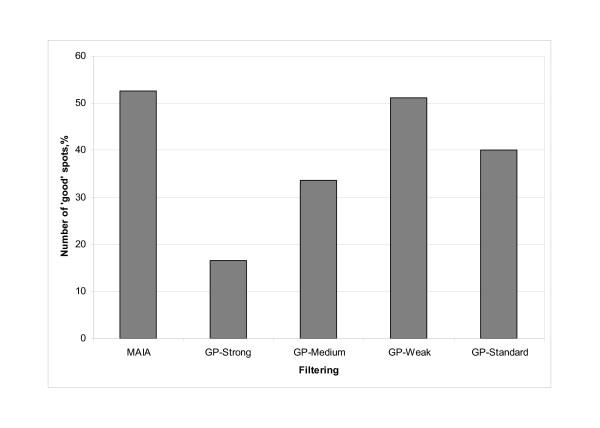
Figure 4.
Average number of "good" spots obtained from spot quality analysis of the whole-genome microarrays using MAIA and four filtering approaches in GP. Series of nine whole-genome microarrays, slides containing 25 392 spots (21 521 70-mers and 3 871 control spots, Operon, human whole genome version 2.0), were printed onto Corning UltraGAPS slides with 48 subgrids of 23 × 23 spots. Differential expression of genes after SNAI1 induction was analysed. Data were analysed using the semi-automatic approach for the spot quality assessment in MAIA and four filtering conditions – standard, weak, medium, and strong (defined in the Table 1) – for the spot quality assessment in GP resulting in two groups of spots: "good" and "bad". The bars show the average number of "good" spots, calculated as a mean of nine microarrays, obtained from spot quality analysis either by MAIA or GP. Results are expressed as percentages relative to the total number of spots in each microarray.

