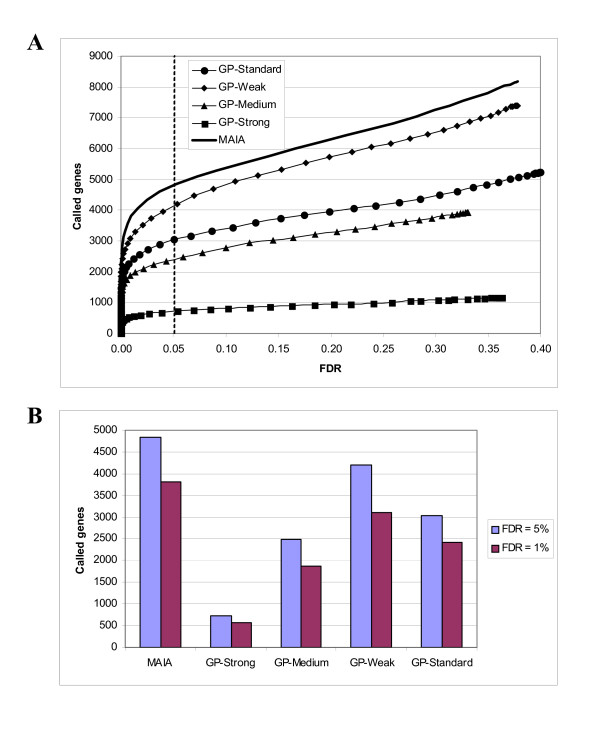
Figure 5.
The SAM plots of the nine whole-genome microarrays resulted from spot quality analysis in MAIA and GP. (A) Number of called genes [24] versus the false discovery rate (FDR) as resulted after SAM analysis of gene lists generated by MAIA and GP-associated analysis. (B) The number of differentially expressed genes (called genes) at FDR = 5 and 1% found by SAM.

