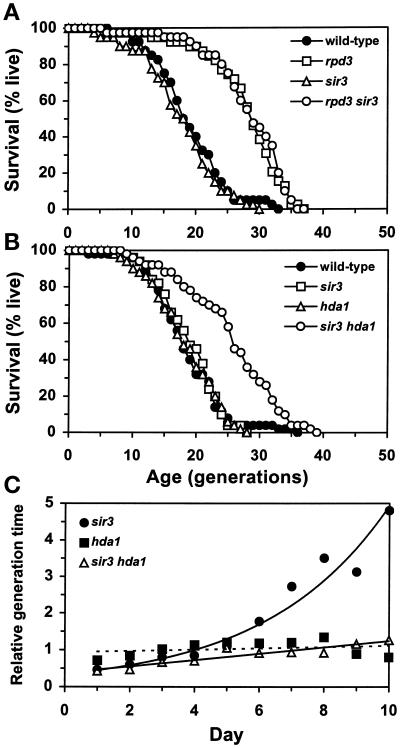
Figure 2.
Effects of SIR3 deletion on life-span and senescence. (A) Survival curves of wild-type (YSK712), rpd3Δ (YSK713), sir3Δ (YSK711), and rpd3Δ sir3Δ (YSK710) segregants of YSK668. Mean life-span (and the number of cells analyzed) was 19.1 (40) for the wild-type, 27.9 (40) for the rpd3Δ, 17.8 (40) for the sir3Δ, and 28.4 (40) for the rpd3Δ sir3Δ strains. The rpd3Δ and rpd3Δ sir3Δ strains differed from wild-type in life-span (P < 0.00001). (B) Survival curves of wild-type (YSK663), hda1Δ (YSK664), sir3Δ (YSK770), and hda1Δ sir3Δ (YSK771) strains. Mean life-span (and the number of cells analyzed) was 18.6 (50) for the wild-type, 18.3 (50) for the hda1Δ, 19.0 (50) for the sir3Δ, and 25.6 (50) for the hda1Δ sir3Δ strains. The life-span of the hda1Δ sir3Δ strain was significantly longer than that of the control, the sir3Δ, or the hda1Δ strains (P = 0.000002, 0.000028, and 0.000002, respectively). (C) Change in generation time of the hda1Δ, sir3Δ, or hda1Δ sir3Δ mother cells relative to the wild-type control during the life-spans shown in B. From the day life-span determination was started, the total number of buds generated by the wild-type mother cells was divided by the total number of buds generated by the hda1Δ, sir3Δ, or hda1Δ sir3Δ mother cells. The resulting number corresponds to an estimate of the average generation time of each mutant strain relative to that of the wild type. The relative generation times were calculated until day 10. By this time, all of the strains completed >96% of their life-spans.

