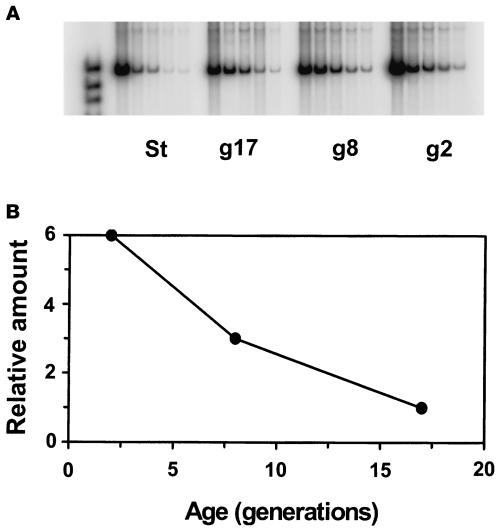
Figure 6.
RT-PCR analysis of the RPD3 mRNA levels in age-synchronized cells. (A) Gel electrophoresis of PCR products. RNA was prepared from young (2-generation old, g2), middle-aged (8-generation old, g8), old (17-generation old, g17), and mixed-age cells from a stationary culture (St). After equalization of the amount of first-strand cDNA synthesized from each of these RNA samples, twofold serial dilutions of each were prepared and subjected to PCR (see MATERIALS AND METHODS). (B) Quantitation of PCR products. The amount of the PCR amplification products obtained for each dilution was quantitated in each lane in A by phosphorimaging. This was plotted against the template concentration. The slopes of the linear regressions obtained are plotted as a function of age to portray the change in mRNA levels during the life-span. The r2 values for the linear regressions were 0.948, 0.981, and 0.958 for the 2-, 8-, and 17-generation–old cells, respectively.

