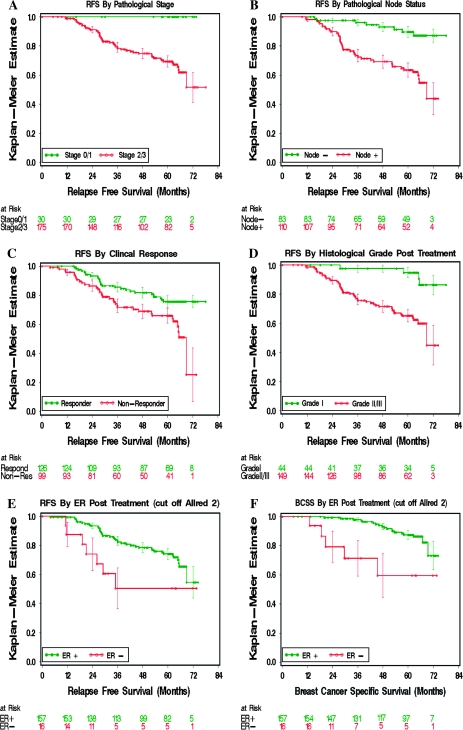
Figure 2.
Kaplan–Meier analysis of relapse-free survival (RFS) and breast cancer–specific survival (BCSS) among women whose tumors were established to be estrogen receptor positive (ER+) at baseline by central laboratory analysis. A) RFS for posttreatment pathological stage 1 or 0 (T1N0 or T0N0, green) vs higher stages (red), P < .001; B) RFS for posttreatment pathological node negative (green) vs node positive (red), P < .001; C) RFS for posttreatment clinical responders (green) vs no clinical response (red), P = .002; D) RFS for posttreatment histological grade (Grade I, green, vs Grade II/III, red), P < .001. E) RFS for patients with ER+ tumors posttreatment (green) vs ER negative (−) tumors posttreatment (red), P = .03; F) BCSS for patients with ER+ tumors posttreatment (green) vs ER− tumors posttreatment (red), P = .002; censorship marks are provided as open circles. All P values (two-sided) were calculated using the log-rank test.

