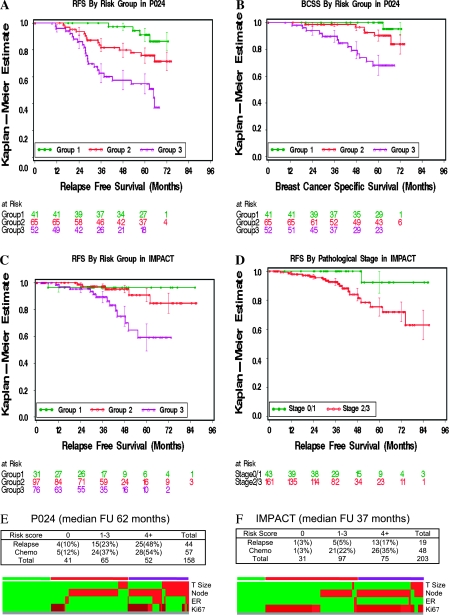
Figure 3.
Development and validation of the Preoperative Endocrine Prognostic Index (PEPI). A) Relapse-free survival (RFS) for the three PEPI risk groups identified in the P024 model with a log-rank statistic to test the overall trend (P < .001). The green line represents group 1, patients with a PEPI risk score of 0; the red line group 2, a PEPI risk score of 1–3; and the purple line group 3, a PEPI risk score of 4 or more. The three groups have distinct risks of relapse. B) PEPI groups 1, 2, and 3 also have distinct risks of breast cancer death, with similar statistical significance as the RFS data (P < .001). C) The PEPI model was validated in the IMPACT trial for RFS, with a statistically significant association between relapse risk and risk score (P = .002). D) Pathological stage (stage 1 or 0 [green line] vs stage 2 or 3 [red line]) has a distinctly favorable outcome in the IMPACT trial (P = .03). Of 43 patients in the stage 1 or 0 group, only one experienced relapse. This patient's tumor had the highest Ki67 level in the stage 1 or 0 group, and had therefore been correctly assigned to PEPI group 2. E) Top, relationships among risk score, relapse events, and adjuvant chemotherapy administration (Chemo) in patients in the P024 trial. Bottom, heat map summarizing the distribution of the individual components of the risk score. F) Top, relationships among risk score, relapse events, and adjuvant chemotherapy administration (Chemo) in patients in the IMPACT trial. Bottom, heat map summarizing the distribution of the individual components of the risk score. The heat maps indicate the presence of a favorable factor (green) or an adverse factor (red) for large tumor size, node-positive status, or estrogen receptor (ER) negativity. The color coding in the Ki67 line of the heat map indicates Ki67 with a risk point of 0 as green, a risk point of 1 as dark red, and risk point of 2 as red. The bar over the heat map indicates the three risk groups generated by the risk point assignments (green, group 1; red, group 2; and purple, group 3).

