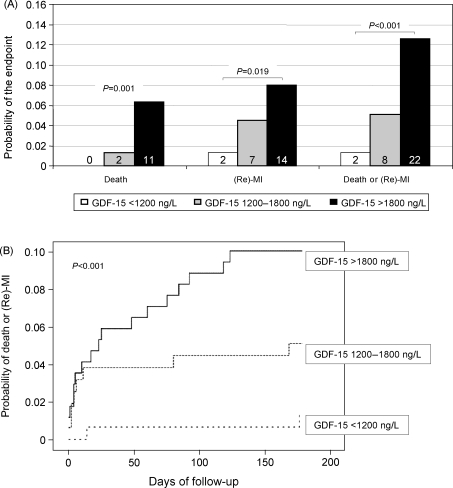
Figure 2.
Outcome according to levels of growth-differentiation factor-15 on admission. (A) The risks of death, (recurrent) MI, and of the composite endpoint after 6 months are shown. The number of events is shown in each bar. (B) The Kaplan–Meier curve illustrating the timing of events for the composite endpoint in the three strata of growth-differentiation factor-15. (Re)-MI denotes (recurrent) myocardial infarction.

