Figure 1.
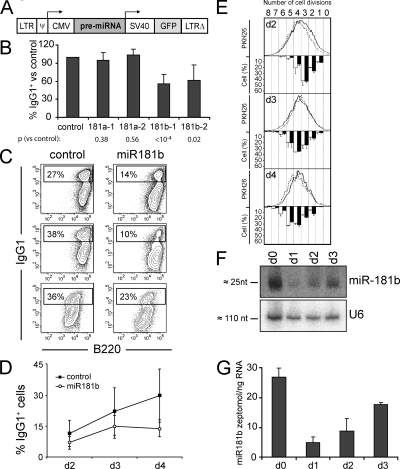
miR-181b expression reduces CSR efficiency. (A) Representation of the pre-miRNA–GFP retroviral vector. (B) miR-181b-1 and -2 isoforms, but not miR-181a-1 or -2 isoforms, decrease CSR. Primary B cells were activated with LPS + IL-4 and were transduced with vectors containing the indicated pre-miRNAs (x axis). CSR efficiency was measured by FACS analysis of IgG1 expression 4 d after retroviral transduction. Bars indicate the mean percentage of IgG1+ cells within the subset of GFP+, transduced cells, normalized to the value obtained in control-transduced cells. Error bars show the SD values in each case. p-values versus control-transduced cells (paired two-tailed t test) are indicated below (n = 14 for miR-181b-1; and n = 5 for miR-181b-2, miR181a-1, and miR181a-2 isoforms). (C) miR-181b reduces CSR efficiency. B cells were activated and transduced as in B. IgG1 CSR efficiency of B cells transduced with control (left) or miR-181b (right) pre-miRNA retroviral vectors was analyzed by flow cytometry after 4 d in culture in the presence of LPS + IL-4. Analysis of IgG1/B220 expression gated on GFP+ cells from three independent representative experiments is shown. Percentages indicate the proportion of IgG1+ (within the GFP+ transduced population) in the displayed gates. (D) Time-course analysis of IgG1 CSR efficiency of control- and miR-181b–transduced B cells in LPS + IL-4 cultures. Means from seven independent experiments are represented. Vertical bars show the SD values at each time point. (P = 0.003, day 3 vs. control using a paired two-tailed t test; P < 0.0001, day 4 vs. control). (E) miR-181b does not affect B cell proliferation. Splenic B cells were labeled with PKH26, and were activated and transduced as in B. The proliferation of transduced cells was assessed by measuring PKH26 dilution in GFP+ cells after 2 (top), 3 (middle), or 4 (bottom) d of LPS + IL-4 stimulation. Histograms show representative flow cytometry profiles of PKH26 (continuous line, control-transduced cells; dashed line, miR-181b–transduced cells). Bars underneath the histograms show the percentage of cells that have undergone each of the indicated cell divisions, as calculated with ModFit software (black bars, control-transduced cells; white bars, miR-181b–transduced cells). Error bars show SD values (n = 2). (F) miR-181b expression is regulated upon B cell activation. RNA from splenic B cells was analyzed by Northern blotting at days 0, 1, 2, and 3 of LPS + IL-4 stimulation for the expression of miR-181b (top gel). Expression of U6 RNA from the same samples is shown as a loading control (bottom gel). (G) Quantification of mature miR-181b expression in B cells. RNA was isolated as in F and retrotranscribed, and mature miR-181b was amplified by real-time PCR. Bars show the amount of miR-181b (in zeptomole/ng RNA) at each time point as calculated with an miRNA reference panel (Fig. S5, available at http://www.jem.org/cgi/content/full/jem.20080579/DC1). Error bars show the SD values (n = 3).

