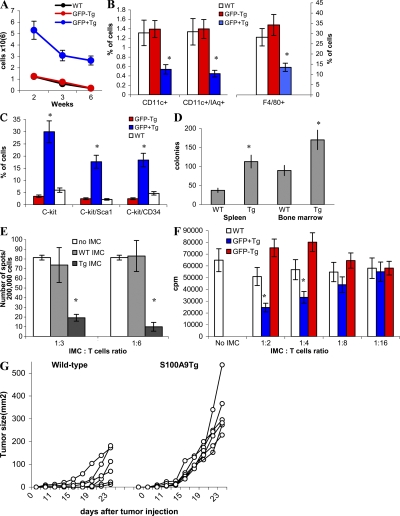
Figure 5.
Phenotype and functional activity of myeloid cells in S100A9 transgenic mice. (A) S100A9Tg mice and their wild-type littermates were killed at indicated times after birth. The number of Gr-1+CD11b+ cells in spleens of wild-type (control) and transgenic mice were evaluated. GFP− and GFP+ splenocytes were counted separately. Each group included three mice. Mean ± SD is shown. (B) The proportion CD11c+ DCs and F4/80+ macrophages in spleens of 3-wk-old wild-type and transgenic mice. (C) The proportion of indicated populations of cells in bone marrow of wild-type and S100A9Tg mice. In transgenic mice, the proportion of cells was calculated separately for GFP+ and GFP− cells. Each group included three mice. Mean ± SD. * represents statistically significant differences between GFP+ and GFP− cells (P < 0.05). (D) Colony formation assay of splenocytes and bone marrow cells isolated from wild-type or S100A9Tg mice. Total myeloid colonies were calculated per 2 × 10⁵ cells in spleen and per 2 × 10⁴ cells in bone marrow. * represents statistically significant differences between WT and Tg mice (P < 0.05). (E) Gr-1+CD11b+ IMC were sorted from spleens of wild-type (WT) or S100A9Tg mice (Tg) and added at a 1:3 or 1:6 ratio to splenocytes from FVB/N mice immunized with specific MHC class I–restricted PDSLRDLSVF peptide. Cells were stimulated with control (RAHYNIVTF) or specific peptides, and the number of IFN-γ–producing cells was evaluated in quadruplicates in ELISPOT assay. The numbers of spots in cells stimulated with control peptide were subtracted from values in cells stimulated with specific peptide. Mean ± SD from three experiments are shown. * represents statistically significant differences from splenocytes cultured without IMC (P < 0.05). (F) Gr-1+CD11b+ IMCs were sorted from WT or S100A9Tg mice (Tg). In transgenic mice, these cells were separated into GFP+ and GFP− cells. T cells were isolated from naive FVB/N mice and DCs were generated from bone marrow of naive BALB/c mice. DCs were mixed with T cells at 1:50 ratio and IMC were added at the indicated ratio. Cells were cultured in triplicates in round-bottomed 96-well plates for 4 d. 3[H]thymidine uptake was measured. Mean ± SD from three experiments are shown. * represents statistically significant differences from splenocytes cultured without IMC (P < 0.05). (G) AVN cells (5 × 10⁵) were injected s.c. into wild-type or S100A9Tg mice and tumor size was monitored. Each group included six mice.

