Figure 5.
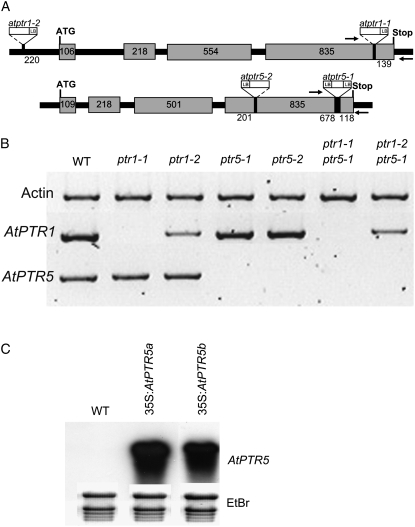
Characterization of homozygous atptr1, atptr5, and atptr1 atptr5 mutants as well as overexpression lines (35S:AtPTR5). A, Position of T-DNA or transposon insertions in the AtPTR1 or AtPTR5 gene. Gray boxes represent exons. Numbers indicate length in base pairs for each exon or distances between exon borders and insertions. Arrows show position of primers used for RT-PCR in B. ATG, Start codon; Stop, stop codon; LB, left border of the insertion. B, Semiquantitative RT-PCR analysis of expression of AtPTR1, AtPTR5, and actin in wild type, the single mutants atptr1-1, atptr1-2, atptr5-1, and atptr5-2, and the double mutants atptr1-1 atptr5-1 and atptr1-2 atptr5-1 using RNA from flowers (AtPTR5) and leaves (AtPTR1). C, Northern-blot analysis of RNA from mature leaves of wild-type plants (WT) and 35S:AtPTR5-overexpressing lines (35S: AtPTR5a and 35S:AtPTR5b). As a loading control, staining with ethidium bromide (EtBr) is shown.

