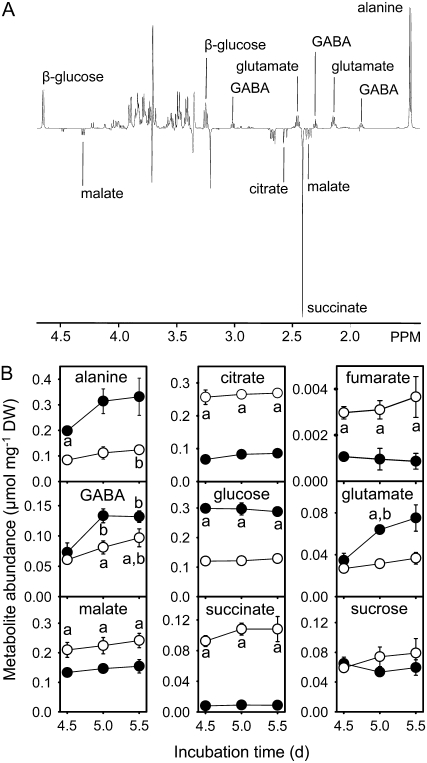
Figure 2.
A, Representative 1H NMR difference spectrum for elevated minus standard O2 conditions. NMR spectra of soluble metabolite extracts of cells grown for 5 d under standard O2 conditions were subtracted from the corresponding spectra for cells grown under elevated O2 conditions. Metabolites giving positive signals in this difference spectrum are more abundant under elevated O2 conditions. B, The abundance of soluble metabolites in Arabidopsis cell suspension cells after 4.5 to 5.5 d incubation under standard (○) or elevated (•) O2 conditions. Errors are ±1 sd (n = 2 or 3). “a” indicates statistically significant differences (Student's t test, P < 0.05) in metabolite abundances between the two conditions for that time point. “b” indicates statistically significant differences (Student's t test, P < 0.05) in metabolite abundance under a particular condition between the indicated time point and 4.5 d growth. No significant differences in abundance were detected between 5 and 5.5 d growth.

