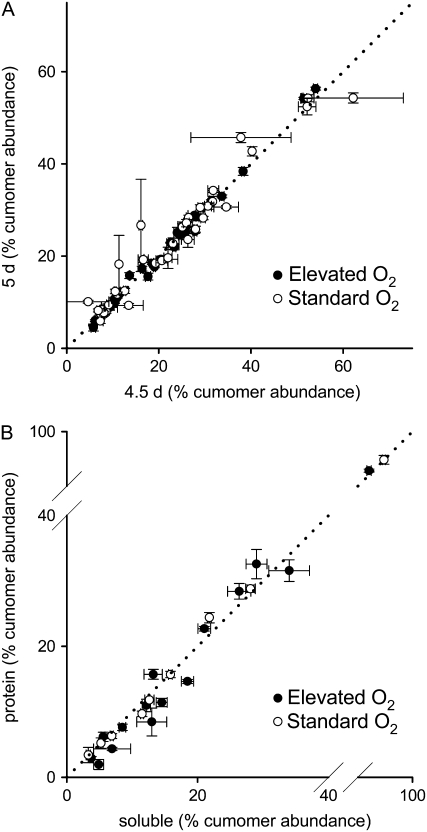
Figure 3.
A, Demonstration of isotopic steady state of soluble metabolites after 5 d growth for cells grown at standard and elevated O2 with [U-13C6]Glc (6% of total Glc supplied) as label source. Errors are ±1 se (n = 3 or 4). B, Demonstration of isotopic steady state of protein amino acids after 5 d growth for cells grown at standard and elevated O2 with [1-13C]Glc as label source. Errors are ±1 sd (n = 2 or 3). In both cases, cumomer abundances are expressed as a percentage of the total label within a metabolite. Dotted lines indicate where cumomer abundances at isotopic steady state should lie.

