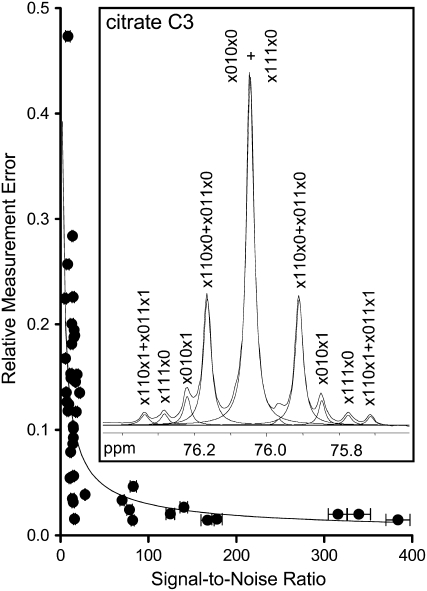
Figure 4.
The dependence of relative error of peak areas on peak SNR in 1D 13C NMR spectra. From these data, power regression was used to define an empirical relationship between relative error (RE) and SNR: RE = 0.62(SNR)−0.66. RE was calculated as the sd of three measurements made on the same sample divided by the average peak area. Measurements were made on a sample of [U-13C6]Glc with a low SNR and on a mixture of Ala, citrate, Glu, Asp, and malate at higher SNR. Errors are ±1 sd (n = 3). Inset, Line-fitting of a representative peak from a 1D 13C NMR spectrum. Line-fitted peaks are indicated with dashed lines. Peak annotations indicate the cumomer abundance defined by the area of the line-fitted peak; 1 corresponds to the presence of 13C at positions 1 to 6 in citrate (standard numbering), 0 corresponds to the presence of 12C, and x corresponds to either 13C or 12C.

