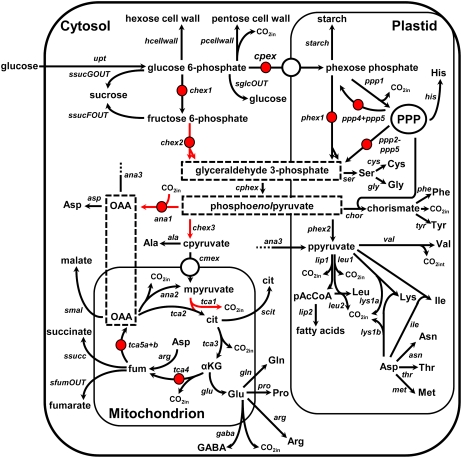
Figure 5.
Metabolic model used for the determination of intracellular fluxes. Free net fluxes are indicated with red arrows, while free exchange fluxes are indicated with red circles. All other exchange fluxes were constrained to zero during parameter fitting. The direction of arrows indicates the direction of positive flux as defined in the model. Flux names are given in italics. Abbreviations: fum (fumarate), OAA (oxaloacetate), cit (citrate), αKG (α-ketoglutarate). Standard abbreviations of amino acid names are used. Dashed boxes indicated where the subcellular localization of a metabolite or reaction cannot be inferred from the data or from the literature. The letters “p”, “c,” and “m” preceding metabolite names indicate separate pools of that metabolite in the plastid, cytosol, and mitochondrion, respectively. PPP indicates the pentose phosphate pathway. Output of CO2 from the system is included in the model but not illustrated here.

