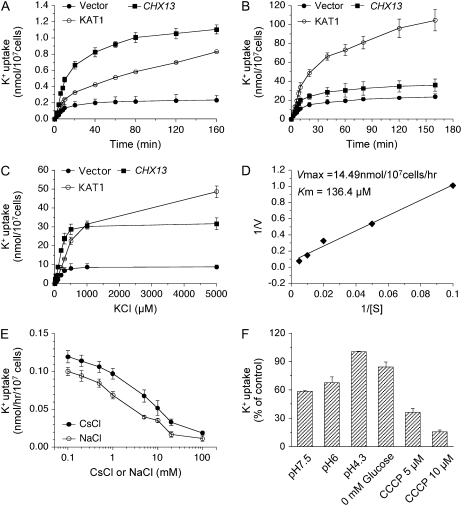
Figure 2.
K+ (86Rb) uptake in yeast cells expressing AtCHX13 and KAT1. Yeast cells were grown in SC medium depleted of K+ for 5 h prior to 86Rb+ uptake. At least three independent experiments were performed with duplicates for each treatment (data points represent means ± sd). A and B, Time course of K+ (86Rb) uptake at 0.02 (A) and 20 mm (B) external K+. C, The uptake rate in the range of 0 to 5,000 μm K+ at 5 min. D, Lineweaver-Burk plot of AtCHX13-mediated K+ (86Rb) uptake. AtCHX13-mediated K+ uptake was obtained by subtracting the uptake in vector control expressing cells from that in the AtCHX13-expressing yeast. [S], K+ concentration (μm); V, K+ uptake rate (nmol h−1 10−7 cells). E, Effect of CsCl and NaCl on AtCHX13-mediated K+ (86Rb) uptake at 20 μm external [K+]. CsCl or NaCl concentrations are detailed in “Materials and Methods.” Except where noted, all uptakes were done with 10 mm Glc, at 5 min and at pH 4.3. F, Effects of pH, Glc, and CCCP on AtCHX13-mediated K+ (86Rb) uptake at 20 μm external [K+]. All assays were conducted with 10 mm Glc unless otherwise indicated. The pH was buffered with 5 mm MES-Tris. CCCP was added to the yeast cells in uptake buffer (pH 4.5) 5 min prior to K+ and 86Rb tracer addition. Glc was excluded in one assay (0 mm Glc) at pH 4.5. Data show uptake at 5 min and 100% activity (pH 4.3, 20 μm external K+) is 0.133 nmol h−1 10−7 cells.

