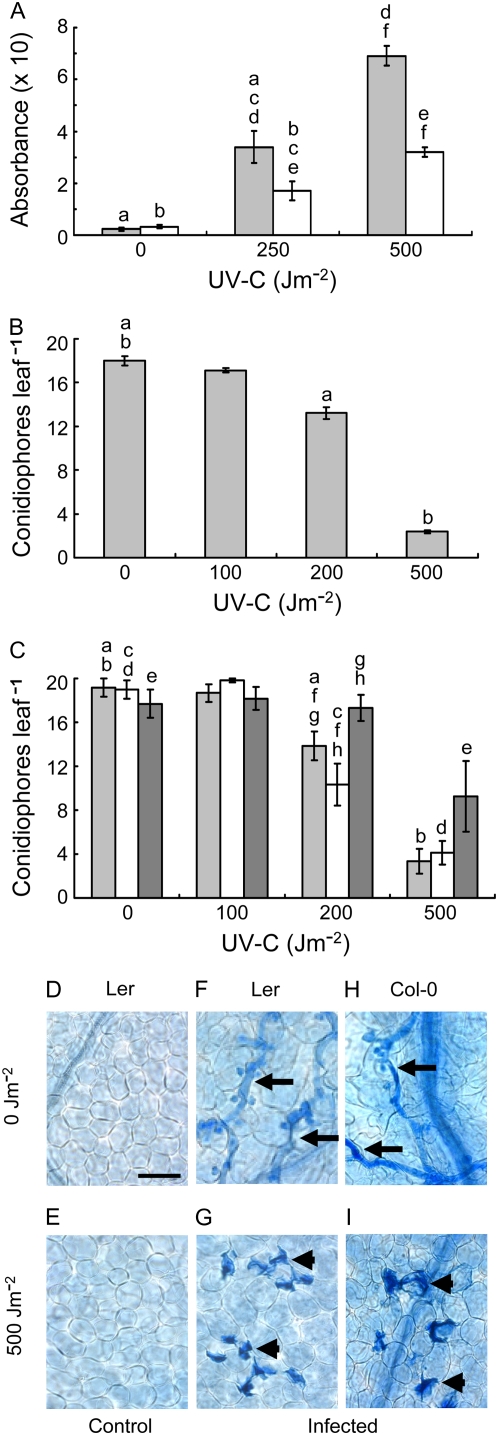
Figure 2.
UV-induced resistance to H. parasitica. A, Plant DNA was isolated 0 h (light gray bars) or 24 h (white bars) after UV irradiation or mock treatment, and CPDs were detected using an ELISA with anti-CPD monoclonal antibodies and spectrophotometric A492. Each column in A represents the mean ± se of three independent measurements. B and C, Ler (B) or Col-0 (C) leaves were inoculated with HpHind4 24 h after UV exposure or with HpNoks1 24 h (light gray bars), 72 h (white bars), or 168 h (dark gray bars) after UV exposure, respectively, and the number of conidiophores per leaf was determined 7 d after inoculation. Each column in B and C, and in all succeeding figures, represents the mean ± se of at least four independent experiments in each of which conidiophores on 48 leaves (four leaves per plant) were counted. D to I, The six bottom images show representative samples of Ler (D–G) or Col-0 (H and I) leaves that were mock inoculated (D and E) or inoculated with HpHind4 (F and G) or HpNoks1 (H and I) 24 h after mock UV treatment (D, F, and H) or UV irradiation (E, G, and I), incubated for 7 d, and then stained with lactophenol-trypan blue. Hyphae-bearing haustoria or HR lesions are indicated by black arrows or arrowheads, respectively. In this, and all succeeding figures, the same lowercase letters above different columns indicate pairs of values that differ significantly (P less than at least 0.05). Bar in D = 50 μm. [See online article for color version of this figure.]

