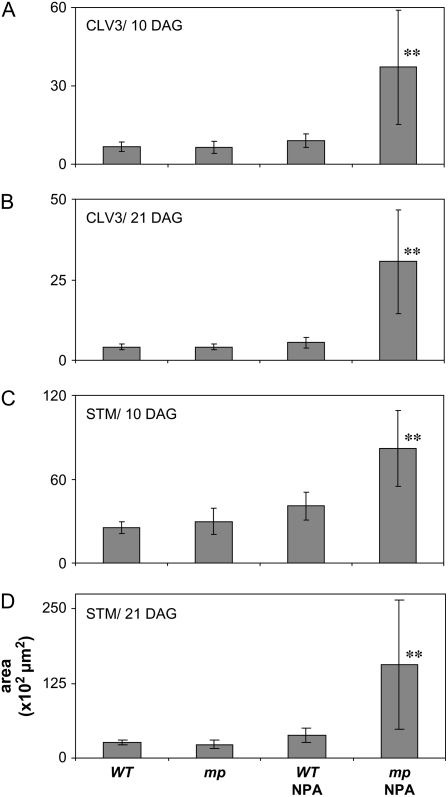
Figure 5.
Quantification of CZ and meristem areas. Wild-type or mp plants were grown in the absence or presence of 10 μm NPA and the areas based on ProCLV3:GFP:ER expression domains at 10 (A) and 21 DAG (B), and ProSTM:GUS expression domains at 10 (C) and 21 DAG (D). The y axis shows measured areas in 102 μm2. Bars represent average of measured areas from six to 13 meristems; error bars are sd. **, Significant difference between NPA-grown mp mutants compared to all other genotypes and treatments, as determined by Student's t test analysis; P < 0.05. Representative images of measured areas are shown in Supplemental Figure S2.

