Figure 8.
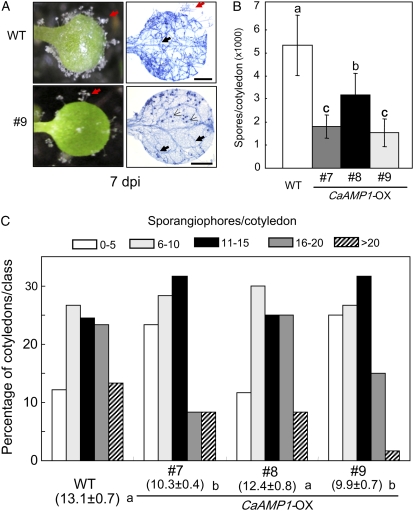
Enhanced resistance of CaAMP1-OX transgenic Arabidopsis plants to H. parasitica isolate Noco2 infection. A, Disease symptoms and trypan blue-stained pathogen structures on 7-d-old cotyledons of wild-type (Col-0) and transgenic plants at 7 d after inoculation. Sporangiophores, hyphae, and oospores of H. parasitica are indicated with red arrows, bold black arrows, and thin black arrows, respectively. dpi, Days after inoculation. Bars=0.5 mm. B, Average number of spores per cotyledon at 6 d after H. parasitica infection. Each experiment contained the spore counts from 40 inoculated cotyledons of wild-type and transgenic lines. C, Number of sporangiophores per cotyledon of wild-type and transgenic plants at 5 d after inoculation with H. parasitica. Sporangiophores were counted on over 50 cotyledons per genotype. Average numbers of sporangiophores produced on the cotyledons of wild-type and transgenic lines are shown below each of the lines tested. Values with different letters show significant differences at P=0.05 according to the lsd test. The experiments were repeated three times with similar results. [See online article for color version of this figure.]

