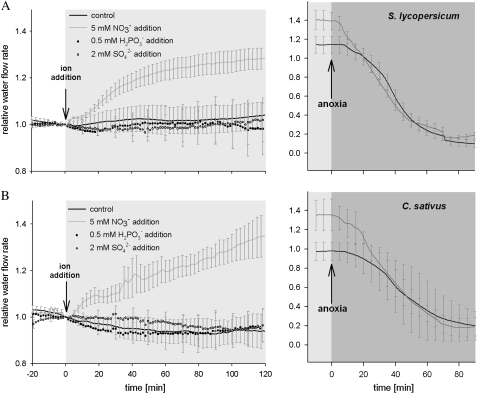
Figure 1.
Pressure-driven exudation from whole root systems of tomato (A) and cucumber (B). Application of nitrate is indicated by downward-pointing arrows and blue shading. Each line is the average of four plants; vertical bars = ses and are shown for every 10th time point. Circular points are average of three points and error bars are presented for every 20th point for clarity. Upward-pointing arrows and dark-gray shading denote application of anoxia, 4 to 5 h after the nitrate addition (note change in vertical scale).

