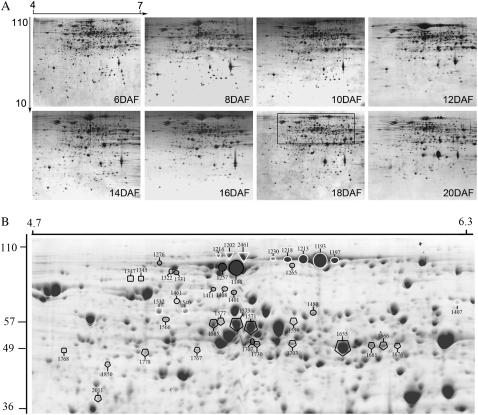
Figure 2.
Representative 2-DE images for eight protein samples (A) and close-up of possible isoforms of some proteins (B). A, Proteins prepared from developing seeds at 6, 8, 10, 12, 14, 16, 18, and 20 DAF were separated by 2-DE and stained by Coomassie Brilliant Blue. The differentially expressed protein spots throughout the eight stages were determined according to the method described in “Materials and Methods”; their relative volume values, identities, and expression patterns are listed in Supplemental Tables S1, S2, and S4, respectively. B, Close-up of part of an 18-DAF sample gel in A to show the isoforms PPDK and some starch synthesis-related proteins, whose identities are listed in Supplemental Table S2. PPDK is labeled in the black-lined circles, pullulanase in the white-lined circles, SP in the white-lined triangles, isoamylase in the black-lined rectangles, PPGM in the white-lined rectangles, and AGPase in the black-lined pentagons. MM (in kilodaltons) and pI of the proteins are shown at left and top, respectively.

