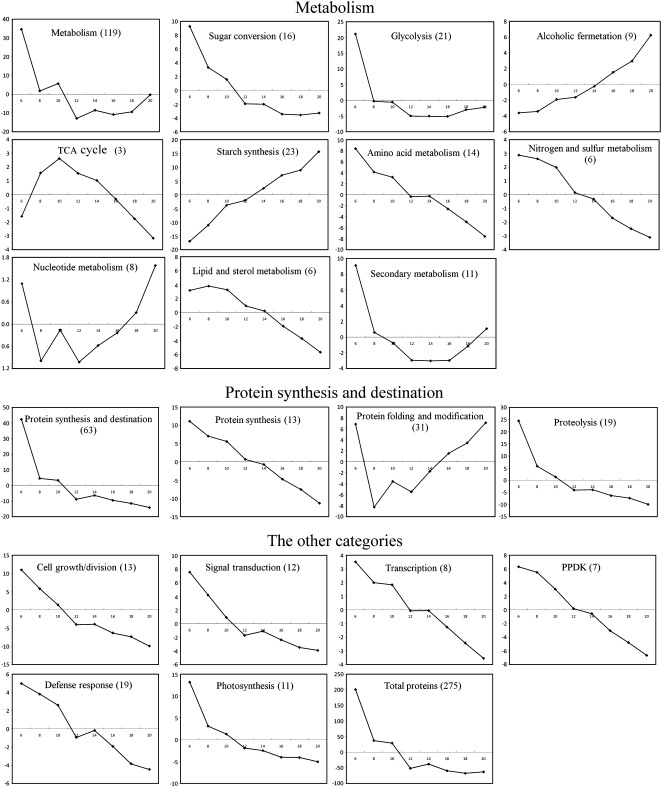
Figure 5.
Digital expression tendencies of protein groups associated with different functional categories and subcategories. The expression tendencies were constructed according to the following equation: y (6 DAF, 8 DAF, 10 DAF, 12 DAF, 14 DAF, 16 DAF, 18 DAF, 20 DAF) = centroids (c0) × amount (c0) + centroids (c1) × amount (c1) + centroids (c2) × amount (c2) + centroids (c3) × amount (c3) + centroids (c4) × amount (c4), for each category or subcategory. Centroid data of each hierarchical cluster are listed in Supplemental Table S6. The total spot numbers used to construct the expression tendencies are indicated in parentheses.

