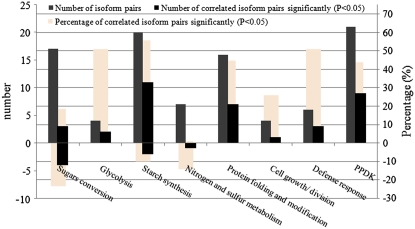
Figure 6.
Correlation analysis of isoform pairs. The numbers of isoform pairs in each category or subcategory are shown in gray bars. The numbers of positively and negatively correlated isoform pairs are shown in black bars as positive and negative numbers on the left vertical axis. The percentages of positively and negatively correlated isoform pairs are shown in beige bars as positive and negative numbers on the right vertical axis. Only a category or subcategory with more than four isoform pairs was analyzed for statistical reasons. The statistical data are listed in Supplemental Table S5.

