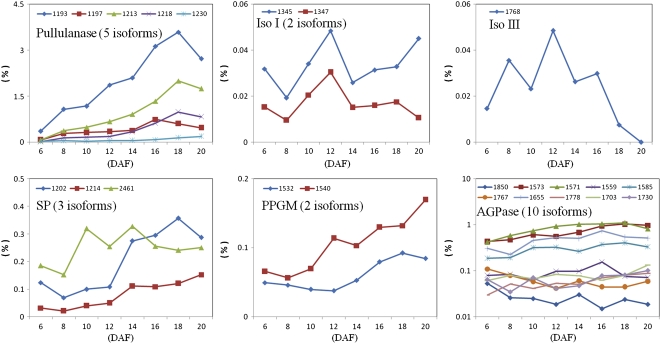
Figure 7.
Expression profiles of proteins involved in starch metabolism. The vertical axis shows the RV value of each isoform (except AGPase) at each developmental stage (DAF; horizontal axis). For AGPase, the RV value was converted into a logarithmic scale to describe each isoform expression profile in a wider extent. Iso I, Isoamylase I; Iso III, isoamylase III.

