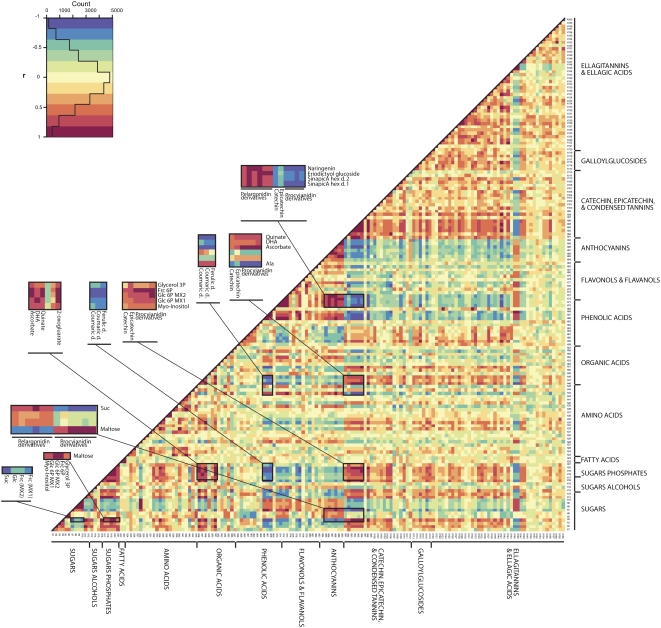
Figure 6.
Visualization of metabolite-metabolite correlations during receptacle development. Heat map of metabolite-metabolite correlations along the developmental period of strawberry fruit. Metabolites were grouped by compound class, and each square represents the correlation between the metabolite heading the column and the metabolite heading the row. Correlation coefficients were calculated by applying the Pearson algorithm using R software. Each square indicates a given r value resulting from a Pearson correlation analysis in a false color scale (see color key at top left). The identity of each metabolite and the correlation coefficient score are given in Supplemental Table S5. Amino acids are listed in standard three-letter abbreviations. BenzA, Benzoic acid; d., derivative; DHA, dehydroascorbate; Frc, Fru; hex, hexose; OH, hydroxy; P, phosphate; Put, putrescine.

