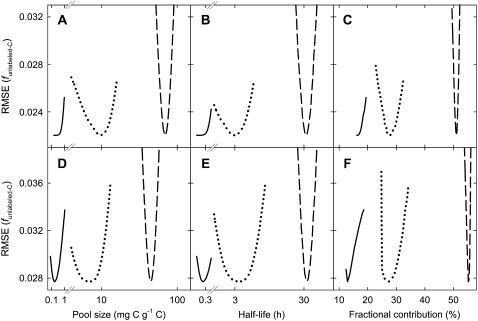
Figure 4.
Sensitivity of the goodness of model fits for the shoot (A–C) and the root (D–F) to departures from optimized values of pool size (A and D), half-life (B and E), and contribution to respiration (C and F). Sensitivity is expressed by the RMSE of the fit (minimum RMSE indicates the optimum value of a model parameter). The solid lines represent Q1, the dotted lines represent Q2, and the dashed lines represent Q3. Note the logarithmic scaling of the x axis for pool size and half-life.

