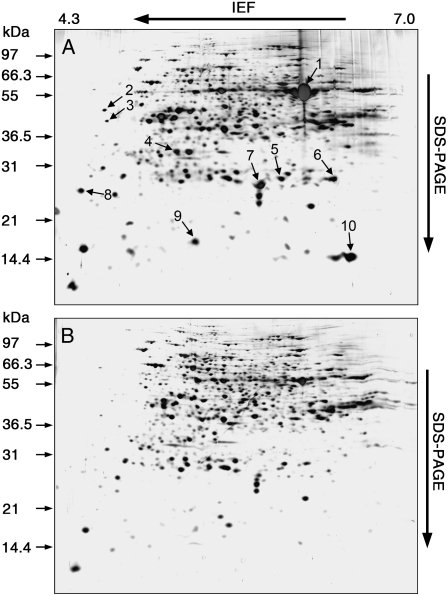
Figure 8.
2-DE analysis of differentially expressed proteins in Ostrxm RNAi plants. Protein samples were separated on 2-DE gels (pI 4–7) and silver-stained. Differentially expressed proteins (decreased levels) in Ostrxm RNAi plants are indicated by arrows. A, Wild type; B, Ostrxm RNAi plants. Relative molecular masses are indicated on the left side (kD). The number of each protein spot (1–10) corresponds to its listing in Table III. Thirty-day-old rice plants grown in a greenhouse (sunlight) were used.

