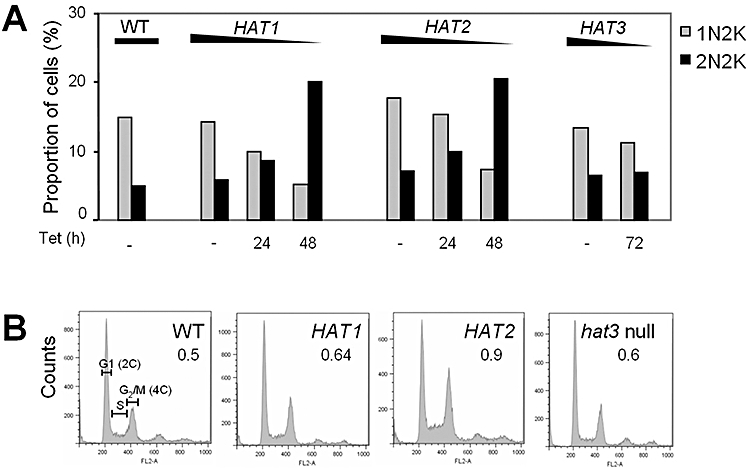
Fig. 5.

Cell cycle analysis following HAT knock-down.
A. Analysis of DAPI-stained T. brucei. 1N2K indicates cells with a single nucleus and two kinetoplasts and corresponds to nuclear G2. 2N2K indicates cells with two nuclei and two kinetoplasts and corresponds to completion of mitosis. n > 300 cells for each sample per time point.
B. DNA content analysis using flow cytometry. HAT1- and HAT2-depleted cells were analysed following 48 h +Tet. A hat3 null strain was analysed in parallel. 2C, cells with a diploid nuclear content; 4C, cells that have passed through S-phase and replicated their DNA. The proportion of 4C relative to 2C is indicated. n = 20 000 cells.
