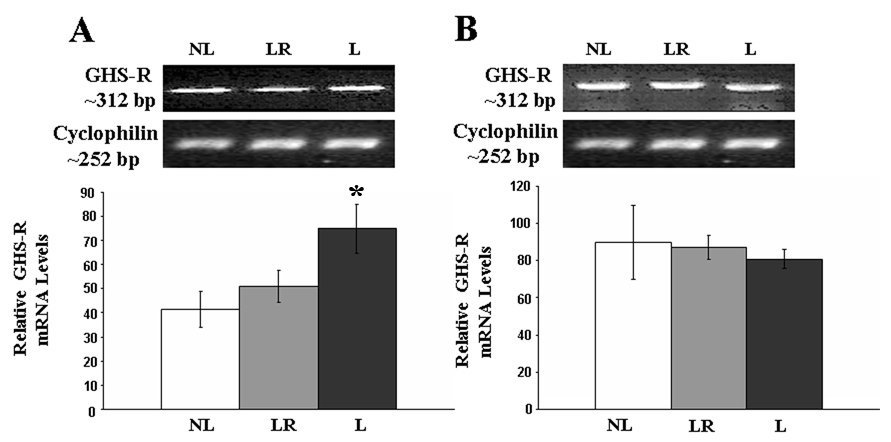
Figure 3.
RT-PCR analysis of GHS-R1a gene expression in A) hypothalamus and B)stomach from NL, LR and L dams. Lactation resulted in increased hypothalamic expression of GHS-R 1a, and the removal of the litters resulted in GHS-R 1a expression that was similar to that of non-lactating animals. Results are expressed as the mean ± SEM. * = significant from NL and D13 (p<0.05).

