
Figure 6. NMR study with purified human NDK1 and a single stranded oligonucleotide substrate.
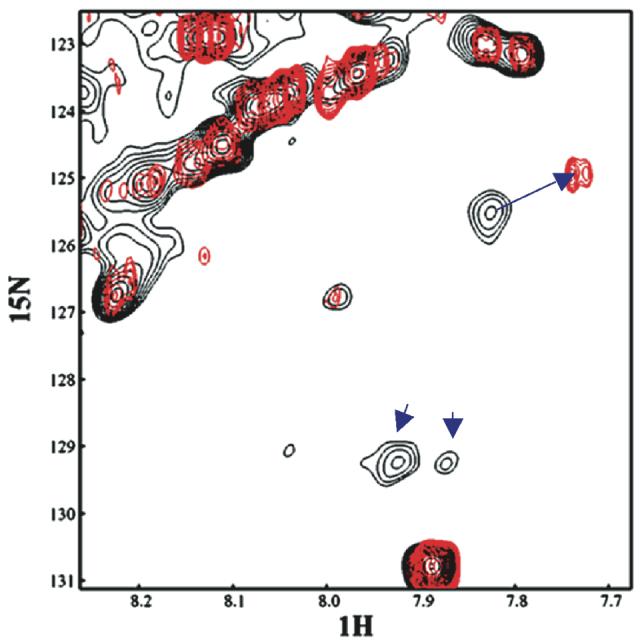
Overlay of a well-resolved region of the 1H-15N HSQC spectra of NDK1, free and bound to DNA. Resonances in black correspond to the spectrum of free NDK1 while those in red correspond to the DNA-bound protein when the protein to DNA ratio is 1:2. The cross peak that shows a specific chemical shift change in this region is indicated by a blue arrow. Two other cross peaks in this region disappeared upon binding to DNA, suggesting that chemical perturbation also occurs in these resonances.