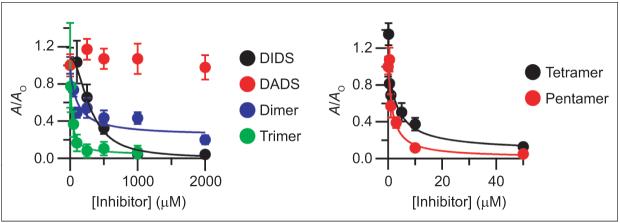
Figure 3.
Inhibition of ClC-ec1 by DIDS hydrolysis products. Activity is reported as in Figure 1, panel c. DIDS (black), DADS (red), dimer (blue), and trimer (green) are shown in the left panel. Tetramer (black) and pentamer (red) are shown in the right panel (note the different x-axis scales on the two graphs). The markers represent the mean activity from three to five experiments, and error bars represent the standard error of the mean. Fits are to the Hill equation: (A/Ao) = (A/Ao)min + [(A/Ao)max - (A/Ao)min]/ [1 + (K1/2/[Inhibitor])-n]. The fit with freshly prepared DIDS solution is the same as shown in Figure 1. For all purified fractions, the Hill coefficient (n) was held at 1. For the dimer, trimer, tetramer, and pentamer, K1/2 values were 110, 20, 3.4, and 1.5 μM, respectively.

