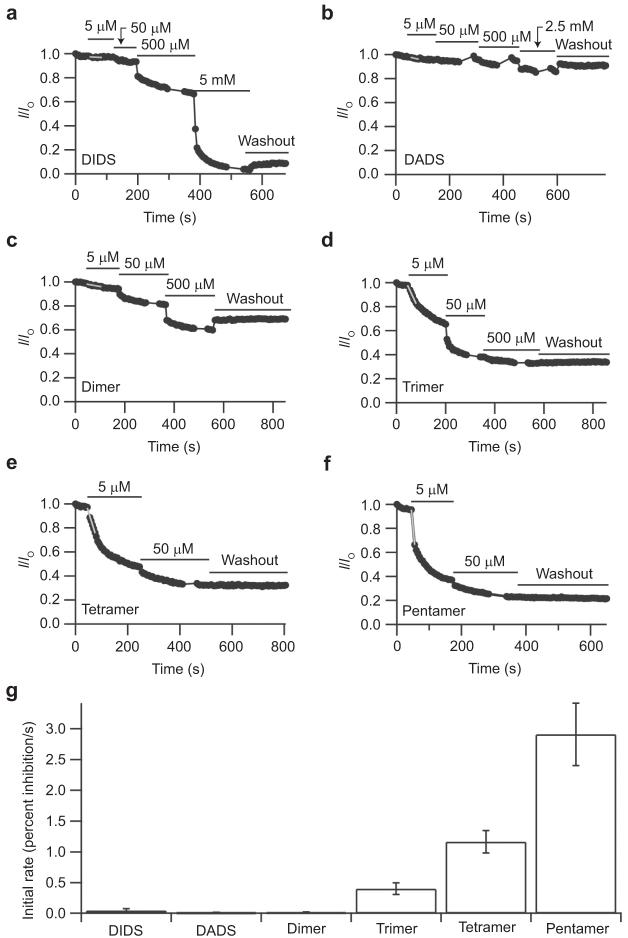
Figure 5.
Effects of intracellular application of DIDS and DIDS hydrolysis products on ClC-0. Time courses of inhibition were measured from inside-out patches for various concentrations of DIDS, DADS, the dimer, trimer, tetramer, and pentamer (panels a-f, respectively). The instantaneous open-channel current at -100 mV (from a prepulse to +50 mV) was determined as a function of time, and current at each time point is normalized to the initial current. The bars above the currents represent the time during which the indicated concentration of inhibitor was applied. Fits of the initial rate of inhibition are shown in gray. g) Initial rate of inhibition (mean ± standard error of mean) by 5 μM of each compound, as determined from three to five experiments from separate oocytes.

