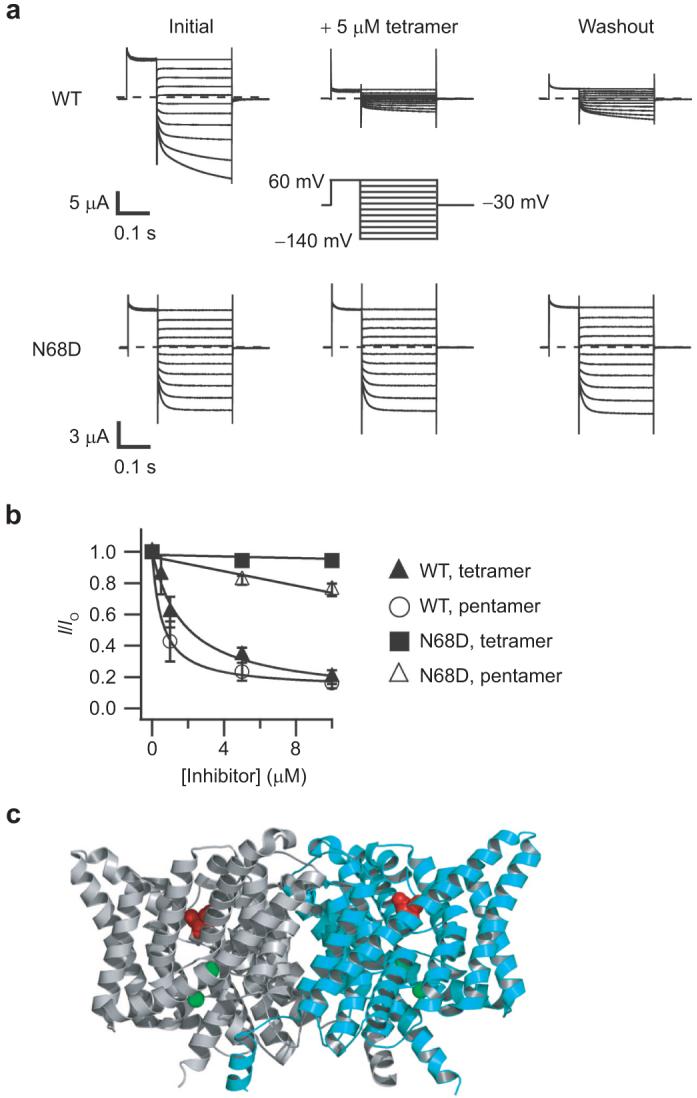
Figure 7.

Inhibition of ClC-Ka and the N68D mutant by extracellular application of the tetramer and pentamer. a) Representative current families are shown from two-electrode voltage-clamp recordings of Xenopus oocytes expressing wild-type ClC-Ka (top) or ClC-Ka containing the point mutant N68D (bottom). Currents were measured initially (left), after steady-state inhibition in 5 μM tetramer (center), and after washing out unbound tetramer for several minutes (right). The voltage protocol is shown in the center. b) The fraction of current remaining after steady-state application of inhibitor is plotted as a function of inhibitor concentration. These currents were measured at the end of the 250 ms test pulse. Solid symbols represent mean inhibition of wild-type (triangles) or the N68D mutant (squares) by the tetramer. Open symbols represent mean inhibition of wild-type (circles) or the N68D mutant (triangles) by the pentamer. Error bars represent the standard error of the mean. Experiments were repeated on three to six oocytes. Fits of the wild-type data were to a Hill equation, (I/Io) = (I/Io)min + [1 - (I/Io)min]/[1 + (K>1/2/[Inhibitor])-n], with n held at 1. For the tetramer, (I/Io)min = 0.07, and K1/2 = 1.8 μM. For the pentamer, (I/Io)min = 0.13, and K1/2 = 0.5 μM. N68D data were fit to a line for easy visualization. c) Structure of ClC-ec1 showing the location of the N68 equivalent residue (D54) spacefilled in red (24). The two subunits are colored gray and cyan, and the two bromide ions bound in the presumed anion permeation pathway are spacefilled in green.
