
Figure 5.
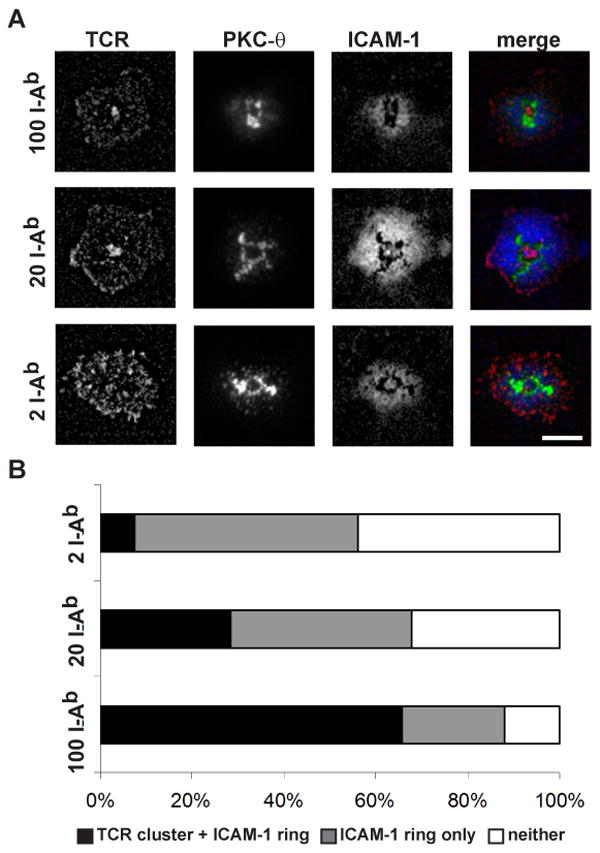
OT-II T cells formed defined cSMAC and pSMAC in the supported planar bilayer system. (A) The supported planar bilayers were armed with 2, 20, or 100 I-Ab-OVA323-339/μm2, and fixed densities of Cy5-ICAM-1-GPI and CD80-GPI. The OT-II effector T cells were allowed to interact with the bilayers at 37°C and fixed at 15 min. TCR was followed with Alexa568-H57 and PKC-θ was detected with a rabbit anti-sera after fixation and permeabilization. In the merged images TCR is shown in red, PKC-θ is shown in green, and ICAM-1 is shown in blue. The scale bar is 5 μm. (B) Quantification of OT-II T cell – bilayer IS pattern formation. All contacts could be categorized as having a central TCR cluster + the ICAM-1 ring, an ICAM-1 ring only, or neither. Chi square test gave a p-value < 0.0001 for I-Ab-OVA323-339 concentration dependence of the patterns.