
Figure 6.
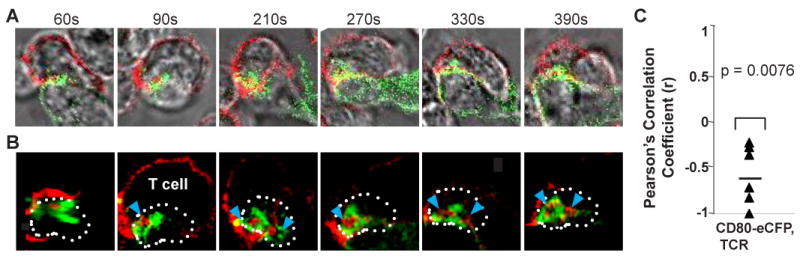
Dynamics of CD80 and TCR clusters in T cell-DC interface. A time series of Alexa 568-H57 Fab labeled OT-II CD4+ TCR Tg T cells interacting with mature CD80-eCFP DC. Time is relative to first detected contact area at 60 second. (A) Transmitted light images of T cell – DC conjugate. The fluorescence intensities of these images were enhanced in order to delineate the physical location of the T cell and DC. (B) Cross-section of a 3-D plane rotated in an en face view. Dotted white line depicts the interface of the IS. CD80 is shown in green and TCR is shown in red. Solid blue arrow depicts cluster of TCR accumulation. This sequence is representative of two experiments with at least 10 cells. (C) The degree of segregation between CD80 and TCR is represented by mean Pearson's Correlation Coefficient r. One sample t-test gave a p value = 0.0076 suggesting that the r value is significantly different from zero and that CD80 and TCR are negatively correlated.