Figure 7.

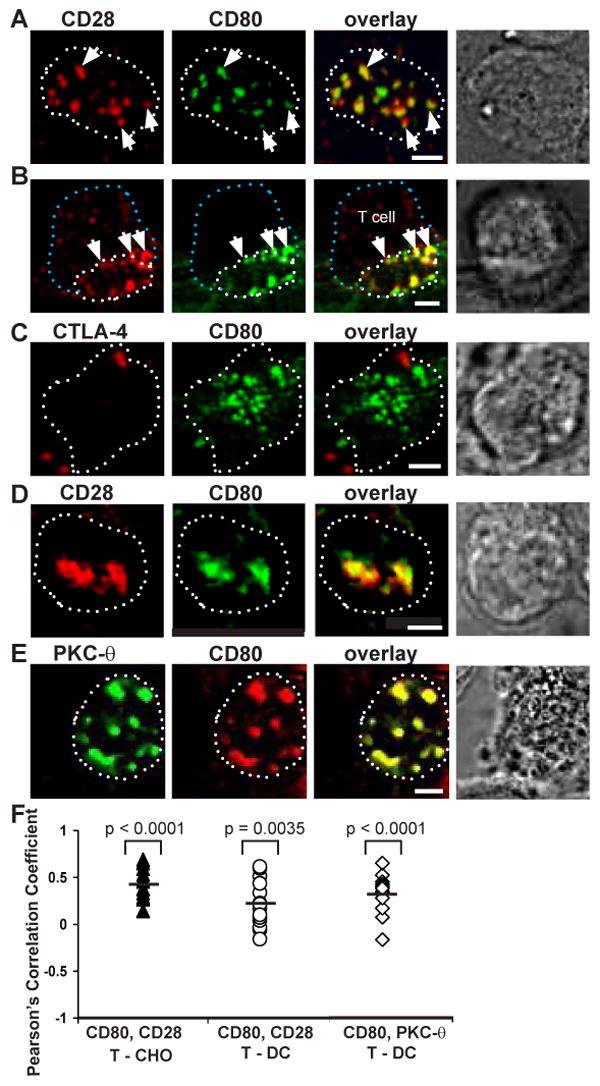
CD80 interactions with its ligands in the IS. T cell-CHO cell conjugates were fixed 15 min after adding 5C.C7 CD4+ T cells. (A-B) CD80 colocalized with CD28 in the IS. (A) en face view of the T cell and CHO cell interface. (B) Cross section of a semi-side view of a T cell and CHO cell conjugate. (C) At this time point, CD80 colocalization with CTLA-4 was not detected in T cell and CHO cell interface. (D) CD28 and CD80 colocalized in the T cell and DC interface of CD80-eCFP (CD80-/+CD86-/-) DC. (E) CD80 clusters colocalized with PKC-θ clusters in the T cell and DC interface of CD80-eCFP (CD80-/+ CD86-/-) DC. (F) Degree of colocalization represented by mean r. Solid triangles represent r for CD80 and CD28 in T cell-CHO cell IS. Open circles represent r for CD80 and CD28 in T cell-DC IS. Open triangles represent r for CD80 and PKC- θ in T cell-DC IS. One sample t-test gave p values < 0.0001, = 0.0035, and < 0.0001, respectively; suggesting that the r value is significantly different from zero and these receptors are positively correlated. CD28, CTLA-4 and PKC-θ are shown in red, CD80 in green, and colocalization in yellow. The dotted white lines represent the limits of the interface, the dotted blue line represents the back of the T cell, and the white arrows depict cluster colocalization. Images were cross-section of a 3-D plane rotated in an en face view. The scale bar is 2 μm.
