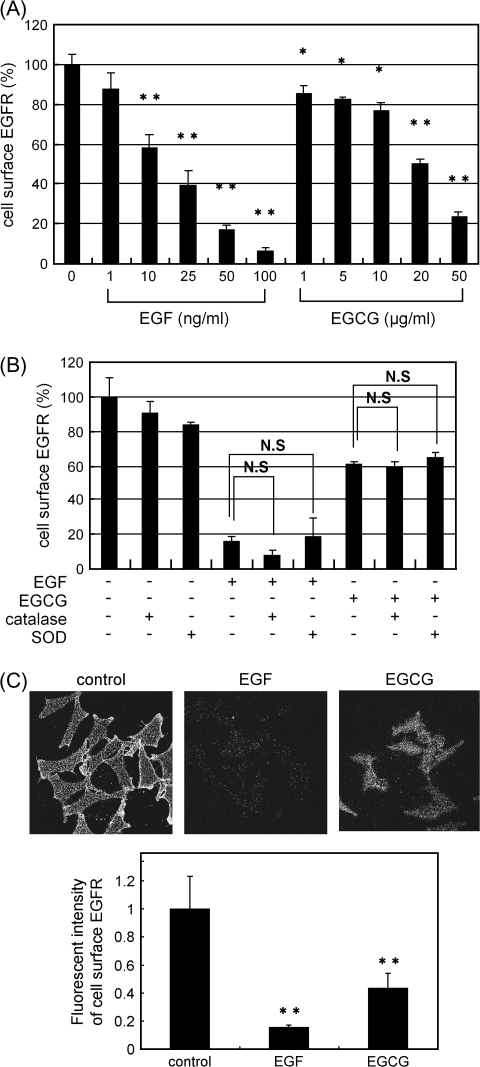
Fig. 1.
Both EGF and EGCG induce decreases in cell surface-associated EGFR. (A) SW480 cells were first labeled for 15 min at 37°C with an anti-EGFR antibody that recognizes the extracellular domain of the EGFR. The cells were treated with EGF or EGCG at the indicated concentration for 30 min at 37°C. The amount of cell surface EGFR was then measured by ELISA (see Materials and Methods). The asterisks indicate a significant decrease (*P < 0.05, **P < 0.01, respectively) with respect to the control (first lane on left). (B) The cells were treated with EGF (100 ng/ml) or EGCG (20 μg/ml) with or without catalase (30 U/ml) or SOD (15 U/ml) for 30 min at 37°C. They were then fixed, exposed to the anti-EGFR antibody and the amount of cell surface-associated EGFR was measured by ELISA as described in (A). NS designates no significant difference between the indicated pairs. (C) The fluorescent intensities of cell surface EGFR was analyzed in untreated cells or cells treated with 100 ng/ml of EGF or 20 μg/ml of EGCG by fluorescence microscopy and the fluorescent intensity of cell surface EGFR was quantitated by the MetaMorph. Representative results from at least three independent experiments are shown. For additional details see Materials and Methods.

