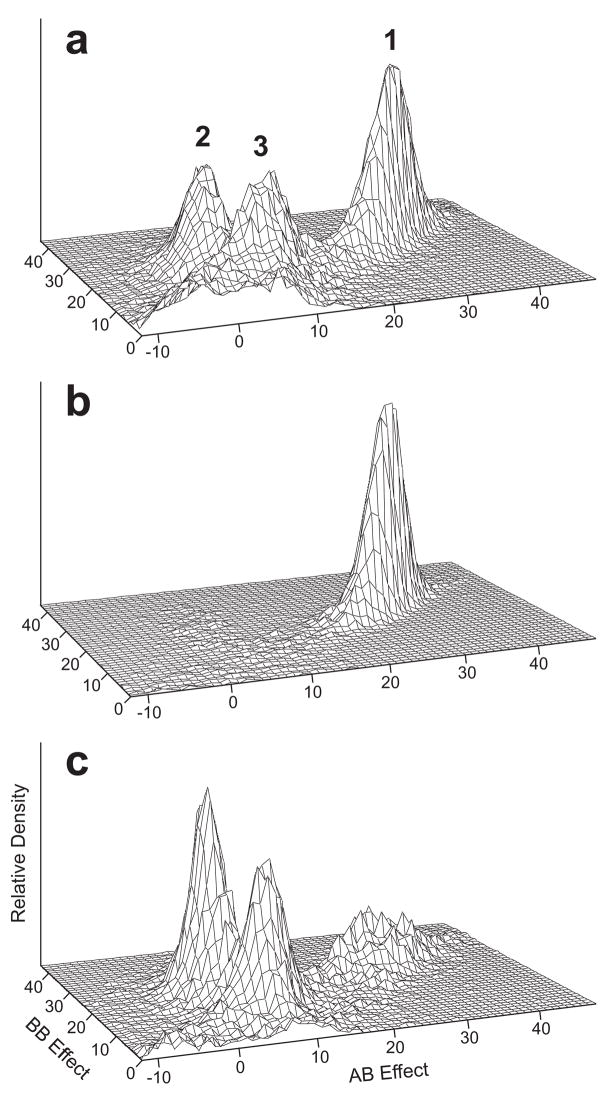
Figure 1.
Plots of the posterior distribution of genotype effects for QTLs fitted in MCMC oligogenic model scans for WID adjusted for age, sex and verbal IQ. The relative posterior density (vertical axis) of QTLs accepted into the model over all MCMC iterations is plotted as a function of the effects of genotypes AB and BB relative to genotype AA (εAB and εBB, respectively). For clarity, allele A is always designated so that the εBB is at least zero, and the range of genotype effects is the same for all three panels. (a) All QTLs accepted in an MCMC segregation analysis. Numbers 1, 2, 3 correspond to the three genetic models WL1, WL2 and WL3 listed in Table I. The plateau of posterior density near the origin represents a background of QTLs of small effect. (b) QTLs placed between 38 and 48 cM in a joint MCMC segregation and linkage analysis of chromosome 15. (c) QTLs placed between 57 and 78 cM in an MCMC analysis of chromosome 12.

