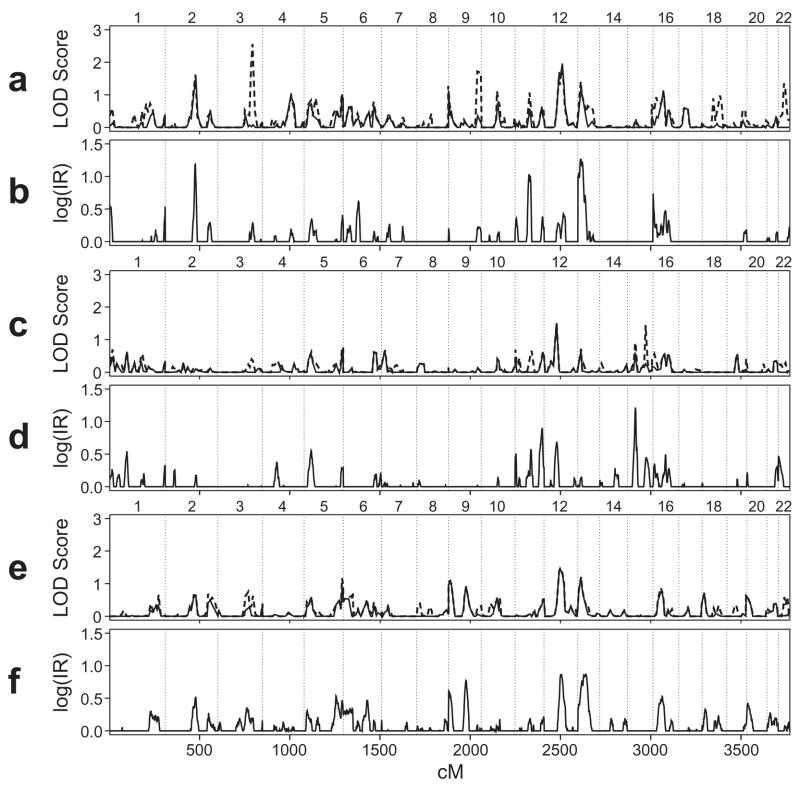
Figure 2.
Whole-genome linkage scans for the phenotypes SWE (a, b), WID (c, d) and SWE adjusted for WID (e, f) using multipoint VC (top panel of each pair, VC-LOD) and MCMC (bottom panel, log(IR)) methods of analysis. VC-LOD scores with and without dominance variance are graphed with dashed and solid lines, respectively. Phenotypes were adjusted for age (with separate slopes for subjects above and below 25 years), sex and verbal IQ. Only MCMC IR values ≥1 (i.e., log(IR) ≥0) are shown, for consistency with the VC-LOD scores, which are bounded below at zero. Chromosome numbers are indicated above each pair of panels.

