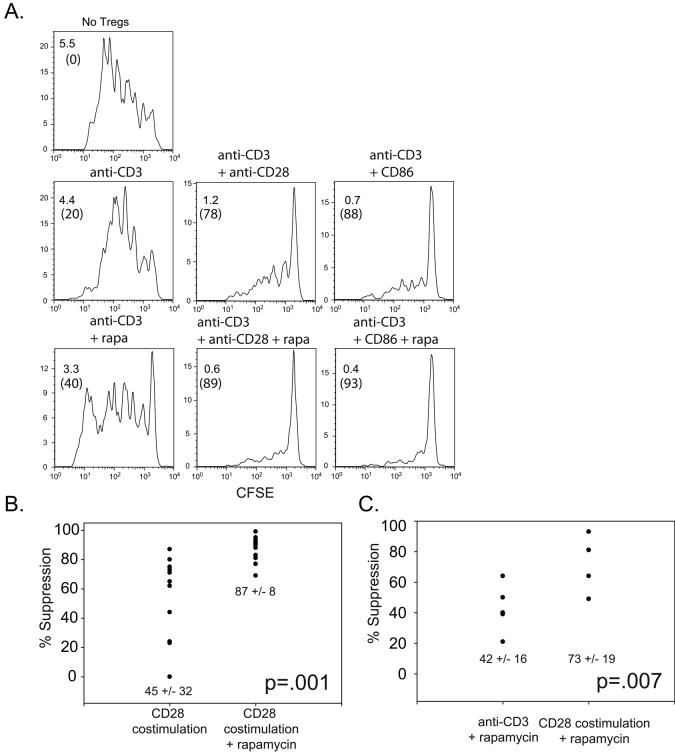
Figure 4. Consistent suppression in vitro by Tregs expanded with CD28 costimulation in the presence of rapamycin.
A. Tregs were expanded using the indicated cell-based aAPC. In a suppression assay, autologous PBMCs were labeled with CFSE and stimulated using anti-CD3 Ab coated beads and mixed with either no Tregs (top panel) or expanded Tregs at a ratio 1:4 (Treg:PBMC). Histograms show the expansion of CD8+ cells. Fold expansion and percent suppression (parentheses) are indicated in the upper left hand corner. B and C. Scatter plots showing the degree by which CD28 costimulated Tregs expanded with and without rapamycin (B) or by which anti-CD3 Ab or anti-CD3 and CD28 costimulated Tregs expanded in rapamycin (C) suppress CD8+ T cell proliferation. Each point represents a separate culture; the average (+/− s.d ) suppressive activity is indicated. Paired T test was performed to determine the significance of differences between each group.

