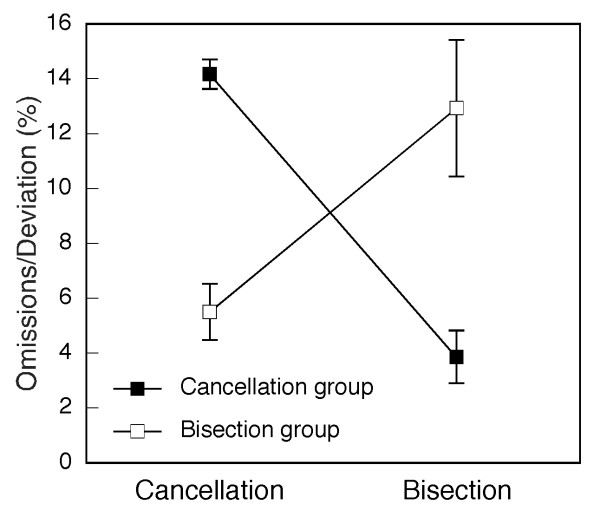
Figure 4.
Performance in cancellation and line bisection of subgroups of patients with neglect. The figure shows average performance of two groups of 6 neglect patients on the cancellation (number of omissions on the left of the sheet, max. = 15) and line bisection (ipsilesional deviation of the estimated midpoint in %) tasks. Error bars show standard error of the mean.

