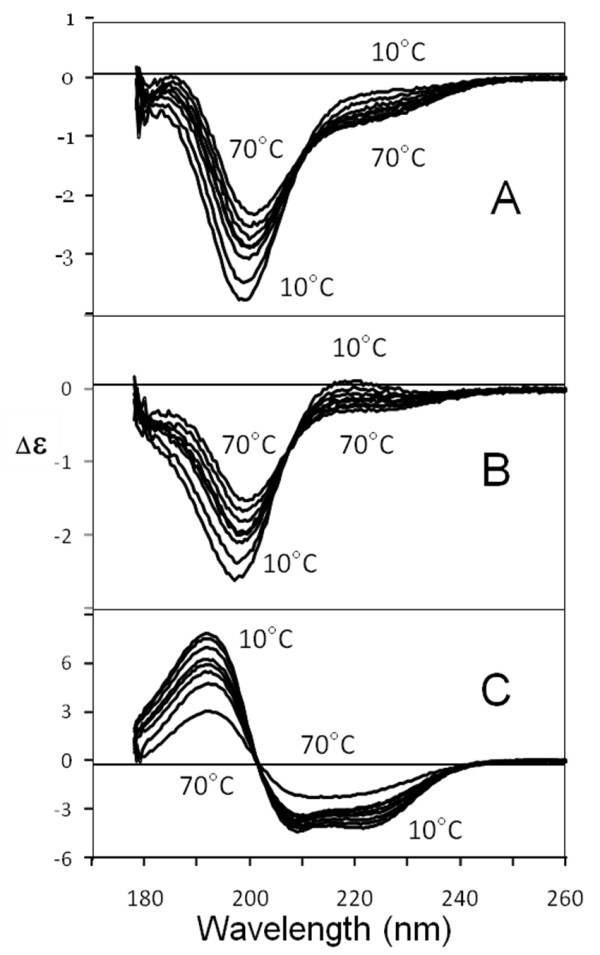
Figure 2.

Circular Dichroism of Tat Eli and control proteins at different temperatures. CD spectra of Tat Eli (A), Protamine (B), and BSA (C). CD spectra were measured from 260 to 178 nm at different temperatures (10, 20, 30, 37, 40, 50, 60, and 70°C) in 20 mM phosphate buffer pH 4.5. Protamine has mainly β-turns in its structure while α-helices are predominant in the structure of BSA. If Tat Eli was a random coil, CD spectra should have been similar at all temperatures tested. This is not the case as the Tat Eli CD signal decreases with the increase in temperature (A) as is the case for the two control proteins (B and C).
