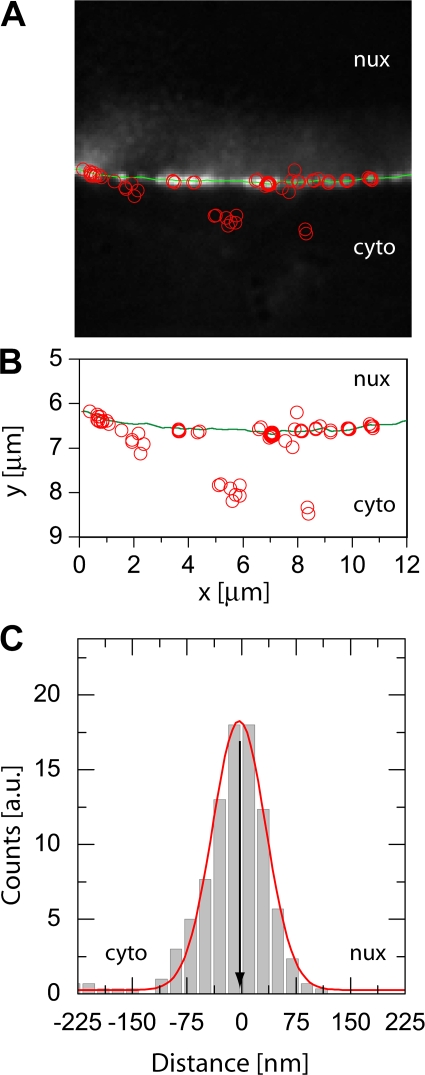
Figure 3.
Single kapβ1 ΔN44 molecules at the NE. For a single cell, all fitted positions (open red circles) were overlaid with the image of the NE. The estimate of the NE position was indicated by a green line in A and B. kapβ1ΔN44 molecules were preferentially observed at the GFP-labeled NPCs, while molecules were only very rarely observed within unlabeled regions of the NE. The fitted positions of both the NE and the single molecules were plotted to scale in B. The individual distances of the kapβ1ΔN44 molecules from the NE were calculated as the shortest distances between the fitted position of the single molecule and the nearest point on the fit through the NPC signals marking the NE. The resulting distance distribution of kapβ1ΔN44 molecules to the NE is shown in C. The position of the NE was defined as zero. Then, negative values described a single molecule position at the cytoplasmic face of the NPC, positive values at the nucleoplasmic face. A fit to a Gaussian yielded a maximum position of the distribution at −3 ± 1 nm with a width (FWHM) of 80 ± 2 nm.

