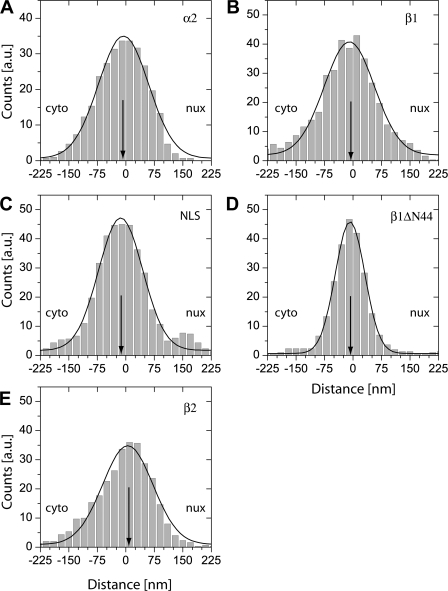
Figure 4.
Binding sites of single molecules at the NE. For all single molecule positions the shortest distance to the NE was calculated, and the results accumulated in distance distribution histograms. Fits of Gaussian functions to the histograms yielded the center position (indicated by an arrow) and width of the distributions. As above, negative distances corresponded to the cytoplasmic side of the NE, positive values to the nucleoplasmic side. (A) kapβ1; (B) kapα2; (C) BSA-NLS; (D) kapβ1ΔN44; and (E) kapβ2. Results of the data analysis are given in Table I.

