Figure 10.
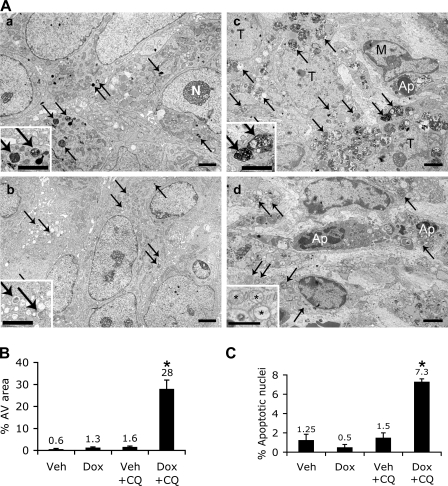
Increased AV accumulation and apoptosis in PC3 tumor with combined Akt123 KD and CQ treatment. (A, a) EM images of PC3-shAkt123 tumors treated for 5 d with CQ only. Arrows, dense AVs and lysosomes; N, nucleolus. (b) Dox only. Arrows, AVs with a less dense appearance than in a. (c and d) Both Dox and CQ. (c) Numerous dense and enlarged AVs (arrows) accumulate in tumor cells. An apoptotic cell (Ap) is partially surrounded by a macrophage (M). T, tumor cell. (d) Apoptotic nuclei (Ap) among the AV-loaded (arrows) tumor cells. Insets, enlarged images of AVs (a–c) and abnormal mitochondria (*) in each tumor. Bars: (a–c) 2 μm; (d) 1 μm. (B) Quantification of the percentage of cytoplasmic area occupied by AVs in randomly sampled cytoplasmic areas (n = 6 areas of >80 μm2). (C) Percentage of apoptotic nuclei among randomly sampled tumor cell nuclei (n = 3–4 sets of 100 tumor cell nuclei). (B and C) Error bars represent SEM; *, P < 0.0005 compared with the other three groups.

