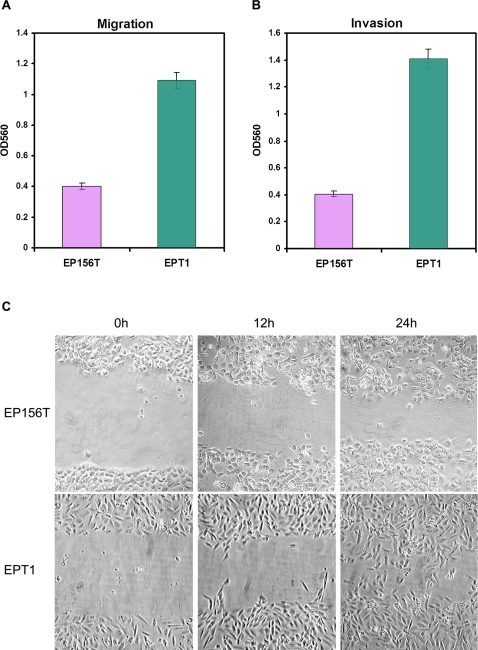
Figure 3. Migration and invasion of EP156T and EPT1 cells.
The migration (A) and invasion (B) abilities of EP156T and EPT1 cells were examined as described in methods. Data are presented as the average OD560 of migrating cells (A) or invading cells (B) in four independent experiments. C. Representative light microscopic images (10×) show increased migration into a wound line of EPT1 compared to EP156T cells.

