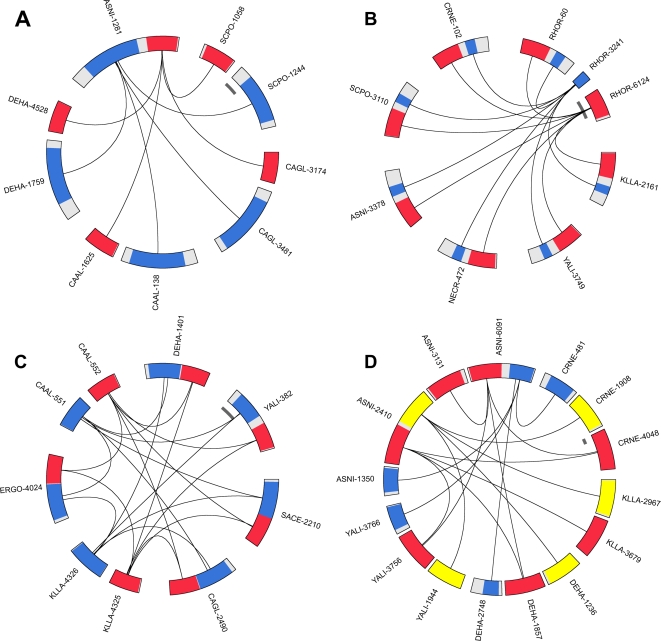
Figure 1. Event examples.
(A) Fusion event, (B) Fission event, (C) Multiple event, (D) Complex event, see Algorithm section for definitions. P-groups are drawn to scale and oriented clockwise. Colored areas represent alignment domains, white areas are non-aligned regions. Arcs symbolize relations of similarity between C-groups and E-groups. The inner grey scale bar corresponds to a length of 100 amino acids.

