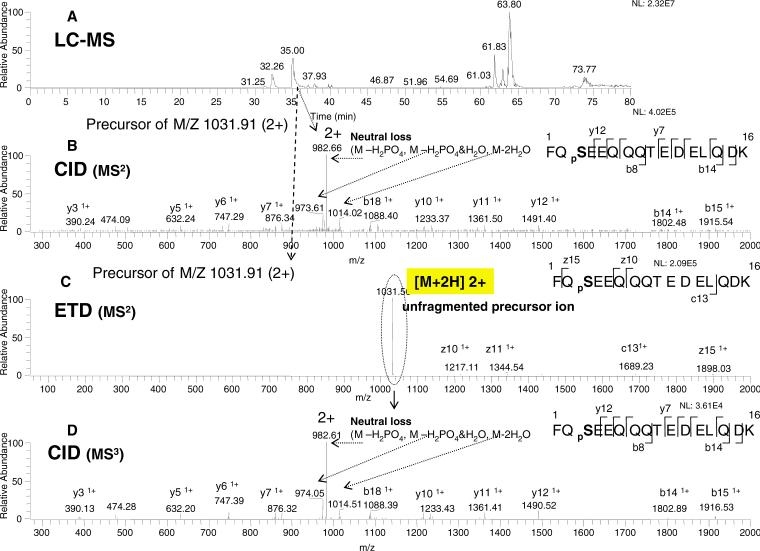
Figure 2. ERPA (CID / ETD) analysis of a monophosphorylated peptide (2+ charge state) from the Lys-C digest of β-casein.
A: Base peak ion chromatogram. B: CID-MS2 spectrum of the m/z 1031.91 (2+) ion eluted at 35.00 min. C: ETD-MS2 spectrum of the m/z 1031.91 (2+) ion eluted at 35.01 min. D: CID-MS3 scan of the m/z 1031.56 ion isolated from the ETD spectrum, as indicated by the dotted circle. The peptide sequences with the observed fragment ions are shown in the insert: phosphoserine is indicated as pS. The neutral loss of phosphate is also shown.

